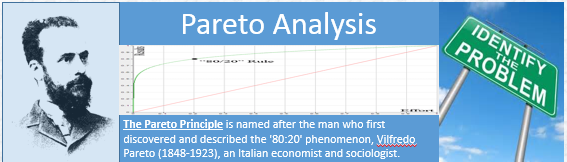
In my earlier Blog titled “Standing up ITIL Problem Management - The Importance of Data” I promised to explain the Pareto analysis
According to the ITIL framework processes can be thought of in terms of
Triggers are the events or circumstances that cause the process to be invoked.
Problem Management like availability management has both reactive and proactive aspects.
Reactive problem management is usually triggered in response to an incident that reoccurs or an incident with major impact
The key point is that reactive problem management like incident management is handling impact that is occurring in relatively real time and has business impact.
Proactive problem management seeks to identify and prevent incidents before they occur or at a minimum introduce methods to reduce the impact.
According to the ITIL framework processes can be thought of in terms of
- Controls
- Triggers
- Activities
- Enablers
Triggers are the events or circumstances that cause the process to be invoked.
Problem Management like availability management has both reactive and proactive aspects.
Reactive problem management is usually triggered in response to an incident that reoccurs or an incident with major impact
The key point is that reactive problem management like incident management is handling impact that is occurring in relatively real time and has business impact.
Proactive problem management seeks to identify and prevent incidents before they occur or at a minimum introduce methods to reduce the impact.
The Pareto analysis is particularly effective at helping IT pros do proactive problem management. In this case we use Pareto analysis to take a collection of incident data and turn it into information about the health of the environment and identify what issues to tackle first. It helps to …
- Identify the problems in the environment
- Decide which subset of problems should be solved first, i.e. Which problems deserve the most attention
- Provide a before-and-after comparison of the effect of control or quality improvement measures
| Pareto charts are relatively easy to produce once you have data. The trick is to massage the data into a form that can be put into a Pareto chart. Here is a simplified model. | 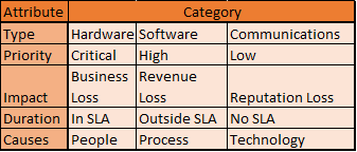 |
We can then count these up and organize them into a Pareto Table and Chart. We sort from highest to lowest, get a cumulative count and calculate the %contribution.
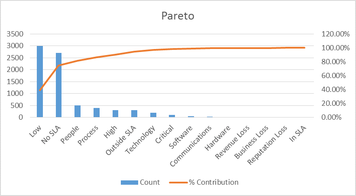 | 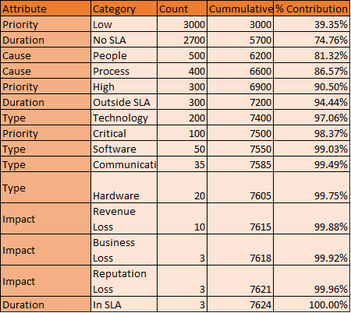 |
We immediately notice that the largest contributor to our incidents are low priority ones and these are skewing the information. We eliminate and redo the charts
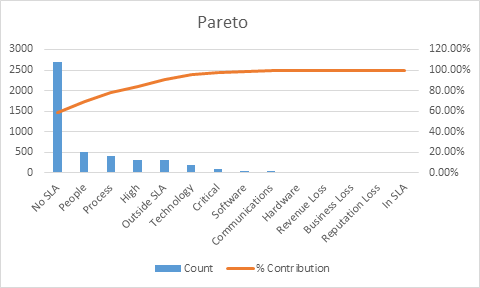 | 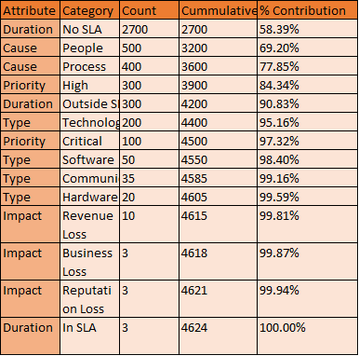 |
From the diagram it is clear that the biggest problem is that there are too many outages that cannot be measured for impact due to not having an SLA. This problem can be assigned to Service level Management.
In general you repeat the exercise drilling down deeper each time. There are many lessons to be learned from Pareto diagrams. I hope this example helps put you on the path.
R.
In general you repeat the exercise drilling down deeper each time. There are many lessons to be learned from Pareto diagrams. I hope this example helps put you on the path.
R.
 RSS Feed